By decisions of the High Qualification Commission of Judges of Ukraine of
December 11, 2024, a selection of candidates for the position of a judge of a local court was announced, taking into account 1,800 projected vacant positions of judges in local courts, and applications were opened for judges who have expressed their intention to be transferred to another local court.
In total, 9,339 persons applied to the Commission, of whom 3,428 intended to sit the exam in the administrative specialisation (3,283 candidates for the position of judge and 145 judges who have expressed their intention to be transferred to another local court).
By decision of the High Qualification Commission of Judges of Ukraine of May 12, 2025 (as amended), the qualification exam was scheduled for candidates for the position of a judge of a local court and for judges who have expressed an intention to be transferred to another local court, and the following sequence of stages for its conduct was established:
the first stage – test on knowledge of the history of Ukrainian statehood;
the second stage – test on general knowledge in the field of law and knowledge in the relevant court specialisation;
the third stage – test of cognitive abilities;
the fourth stage – completion of a practical assignment in the relevant court specialisation.
A total of 3,051 persons were admitted to the test on knowledge of the history of Ukrainian statehood (exam in the administrative specialisation).
Composition of participants:
-
judges of local courts – 138:
-
judges of administrative courts – 18;
-
judges of general courts – 120;
-
candidates for the position of a judge – 2,913:
-
court staff – 915;
-
prosecution staff – 621;
-
attorneys – 356;
-
military personnel – 148;
-
other specialists – 873.
The overall gender distribution of participants admitted to the first stage of the qualification exam and intending to sit the exam in the administrative specialisation was balanced:
women – 50%;
men – 50%.
Age distribution of participants admitted to the first stage of the qualification exam – test on knowledge of the history of Ukrainian statehood – and intending to sit the exam in the administrative specialisation
|
* age at the time of submission of documents for participation in the selection procedure |
|||||
|
No. z/p |
Place of work |
From 30 to 35 years (persons*) |
From 36 to 40 years (persons*) |
41 years and over (persons*) |
TOTAL |
|
1. |
Judges of local courts |
0 |
52 |
86 |
138 |
|
1.1. |
Judges of administrative courts |
0 |
6 |
12 |
18 |
|
1.2. |
Judges of general courts |
0 |
46 |
74 |
120 |
|
2. |
Candidates for the position of judge |
1,178 |
993 |
742 |
2,913 |
|
2.1. |
Court staff |
411 |
336 |
168 |
915 |
|
2.2. |
Prosecution staff |
275 |
194 |
152 |
621 |
|
2.3. |
Attorneys |
123 |
117 |
116 |
356 |
|
2.4. |
Military personnel |
55 |
48 |
45 |
148 |
|
2.5. |
Other specialists |
314 |
298 |
261 |
873 |
|
TOTAL |
1,178 |
1,045 |
828 |
3,051 |
|
As a result of the first stage of the qualification exam – the test on knowledge of the history of Ukrainian statehood – a total of 2,632 persons were admitted to the second stage of the qualification exam, namely the test on general knowledge in the field of law and knowledge in the specialisation of a local administrative court.
Composition of participants:
-
judges of local courts – 121:
-
judges of administrative courts – 14;
-
judges of general courts – 107;
-
candidates for the position of judge – 2,511:
-
court staff – 841;
-
prosecution staff – 532;
-
attorneys – 287;
-
military personnel – 120;
-
other specialists – 731.
The overall gender distribution of participants admitted to the second stage of the qualification exam is relatively balanced:
women – 51%;
men – 49%.
Age distribution of participants admitted to the second stage of the qualification exam – test on general knowledge in the field of law and knowledge in the specialisation of a local administrative court
|
* age at the time of submission of documents for participation in the selection procedure |
|||||
|
No. z/p |
Place of work |
From 30 to 35 years (persons*) |
From 36 to 40 years (persons*) |
41 years and over (persons*) |
TOTAL |
|
1. |
Judges of local courts |
0 |
47 |
74 |
121 |
|
1.1. |
Judges of administrative courts |
0 |
6 |
8 |
14 |
|
1.2. |
Judges of general courts |
0 |
41 |
66 |
107 |
|
2. |
Candidates for the position of judge |
1,039 |
851 |
621 |
2,511 |
|
2.1. |
Court staff |
381 |
315 |
145 |
841 |
|
2.2. |
Prosecution staff |
240 |
164 |
128 |
532 |
|
2.3. |
Attorneys |
106 |
95 |
86 |
287 |
|
2.4. |
Military personnel |
44 |
41 |
35 |
120 |
|
2.5. |
Other specialists |
268 |
236 |
227 |
731 |
|
TOTAL |
1,039 |
898 |
695 |
2,632 |
|
As a result of the second stage of the qualification exam – test on general knowledge in the field of law and knowledge in the specialisation of a local administrative court – a total of 604 persons were admitted to the third stage of the qualification exam, namely test of cognitive abilities (specialisation of a local administrative court).
-
judges of local courts – 33:
-
judges of administrative courts – 6;
-
judges of general courts – 27;
-
candidates for the position of judge – 571:
-
court staff – 281;
-
prosecution staff – 82;
-
attorneys – 53;
-
military personnel – 132;
-
other specialists – 23.
Among the participants admitted to the third stage of the qualification exam, there is a higher proportion of women: women – 56%, men – 44% of the total number of participants.
Age distribution of participants admitted to the third stage of the qualification exam – test of cognitive abilities (specialisation of a local administrative court)
|
* age at the time of submission of documents for participation in the selection procedure |
|||||
|
No. z/p |
Place of work |
From 30 to 35 years |
From 36 to 40 years |
41 years and over |
TOTAL |
|
(persons*) |
(persons*) |
(persons*) |
(persons*) |
||
|
1. |
Judges of local courts |
0 |
12 |
21 |
33 |
|
1.1. |
Judges of administrative courts |
0 |
2 |
4 |
6 |
|
1.2. |
Judges of general courts |
0 |
10 |
17 |
27 |
|
2. |
Candidates for the position of judge |
273 |
179 |
119 |
571 |
|
2.1. |
Court staff |
149 |
97 |
35 |
281 |
|
2.2. |
Prosecution staff |
36 |
24 |
22 |
82 |
|
2.3. |
Attorneys |
27 |
13 |
13 |
53 |
|
2.4. |
Military personnel |
10 |
8 |
5 |
23 |
|
2.5. |
Other specialists |
51 |
37 |
44 |
132 |
|
TOTAL |
273 |
191 |
140 |
604 |
|
As a result of the third stage of the qualification exam – test of cognitive abilities (specialisation of a local administrative court) – a total of 400 persons were admitted to the fourth stage of the qualification exam, namely the completion of the practical assignment in the specialisation of a local administrative court.
Composition of participants:
-
judges of local courts – 21:
-
judges of administrative courts – 5;
-
judges of general courts – 16;
-
candidates for the position of judge – 379:
-
court staff – 170;
-
prosecution staff – 68;
-
attorneys – 38;
-
military personnel – 14;
-
other specialists – 89.
Among the participants admitted to the fourth stage of the qualification exam, women predominate, accounting for 54% of the total number of participants.
Age distribution of participants admitted to the fourth stage of the qualification exam – completion of the practical assignment in the specialisation of a local administrative court
|
* age at the time of submission of documents for participation in the selection procedure |
|||||
|
No. z/p |
Place of work |
From 30 to 35 years |
From 36 to 40 years |
41 years and over |
TOTAL |
|
(persons*) |
(persons*) |
(persons*) |
(persons*) |
||
|
1. |
Judges of local courts |
0 |
6 |
15 |
21 |
|
1.1. |
Judges of administrative courts |
0 |
1 |
4 |
5 |
|
1.2. |
Judges of general courts |
0 |
5 |
11 |
16 |
|
2. |
Candidates for the position of judge |
205 |
104 |
70 |
379 |
|
2.1. |
Court staff |
105 |
47 |
18 |
170 |
|
2.2. |
Prosecution staff |
32 |
20 |
16 |
68 |
|
2.3. |
Attorneys |
23 |
8 |
7 |
38 |
|
2.4. |
Military personnel |
8 |
3 |
3 |
14 |
|
2.5. |
Other specialists |
37 |
26 |
26 |
89 |
|
TOTAL |
205 |
110 |
85 |
400 |
|
Successful completion of the practical assignment in the specialisation of a local administrative court
A total of 397 persons appeared to perform the practical assignment, representing 99% of the total number of participants:
-
judges of local courts – 21 persons, or 100% of the total number in this group:
-
judges of administrative courts – 5 persons, or 100% of the total number in this group;
-
judges of general courts – 16 persons, or 100% of the total number in this group;
-
candidates for judicial office – 376 persons, or 99% of the total number in this group:
-
court staff – 170 persons, or 100% of the total number in this group;
-
prosecution staff – 67 persons, or 99% of the total number in this group;
-
attorneys – 38 persons, or 100% of the total number in this group;
-
other specialists – 87 persons, or 98% of the total number in this group;
-
military personnel – 14 persons, or 100% of the total number in this group.
Three persons did not appear.
The minimum passing score for the practical assignment is 112,5 points.
The maximum possible score is 150 points.
|
Success rate of the fourth stage of the qualification exam “Completion of the practical assignment in the specialisation of a local administrative court” |
|||||||||||
|
No. z/p |
Place of work |
112 points and less |
From 112,5 to 120 points |
From 120,5 to 130 points |
From 130,5 points and over |
TOTAL |
|||||
|
persons |
%* |
persons |
%* |
persons |
%* |
persons |
%* |
persons |
%* |
||
|
Judges of local courts |
2 |
9,5% |
11 |
52,4% |
7 |
33,3% |
1 |
4,8% |
21 |
100% |
|
|
1.1. |
Judges of administrative courts |
0 |
0,0% |
3 |
60,0% |
2 |
40,0% |
0 |
0,0% |
5 |
23,8% |
|
1.2. |
Judges of general courts |
2 |
12,5% |
8 |
50,0% |
5 |
31,3% |
1 |
6,3% |
16 |
76,2% |
|
2. |
Candidates for the position of judge |
113 |
30,1% |
119 |
31,6% |
122 |
32,4% |
22 |
5,9% |
376 |
100% |
|
2.1. |
Court staff |
41 |
24,1% |
51 |
30,0% |
66 |
38,8% |
12 |
7,1% |
170 |
45,2% |
|
2.2. |
Prosecution staff |
21 |
31,3% |
23 |
34,3% |
22 |
32,8% |
1 |
1,5% |
67 |
17,8% |
|
2.3. |
Attorneys |
10 |
26,3% |
12 |
31,6% |
13 |
34,2% |
3 |
7,9% |
38 |
10,1% |
|
2.4. |
Military personnel |
7 |
50,0% |
3 |
21,4% |
4 |
28,6% |
0 |
0,0% |
14 |
3,7% |
|
2.5. |
Other specialists |
34 |
39,1% |
30 |
34,5% |
17 |
19,5% |
6 |
6,9% |
87 |
23,1% |
|
TOTAL |
115 |
29,0% |
130 |
32,7% |
129 |
32,5% |
23 |
5,8% |
397 |
100% |
|
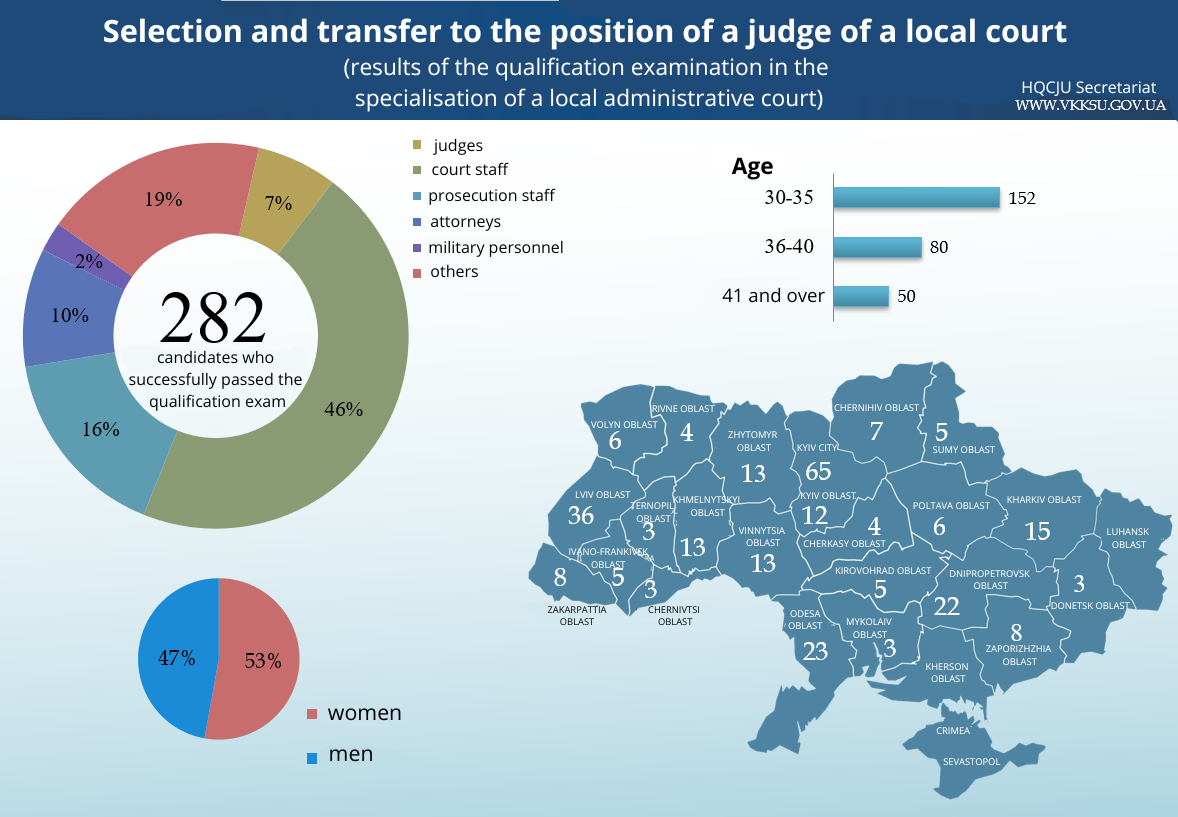
As a result of the fourth stage of the qualification exam – completion of the practical assignment in the specialisation of a local administrative court – a total of 282 persons successfully passed the qualification exam.
Composition of participants:
a) judges of local courts – 19 (or 90% of those who completed the practical assignment):
-
judges of administrative courts – 5;
-
judges of general courts – 14;
b) candidates for the position of judge – 263 (or 70% of those who completed the practical assignment):
-
court staff – 129;
-
prosecution staff – 46;
-
attorneys – 28;
-
other specialists – 53;
-
military personnel – 7.
Gender distribution of participants who successfully passed the qualification exam (specialisation of a local administrative court)
|
No. z/p |
Place of work |
Women |
Men |
TOTAL |
|||
|
persons |
%* |
persons |
%* |
persons |
%* |
||
|
1. |
Judges of local courts |
11 |
57,9% |
8 |
42,1% |
19 |
100% |
|
1.1. |
Judges of administrative courts |
2 |
40,0% |
3 |
60,0% |
5 |
26,3% |
|
1.2. |
Judges of general courts |
9 |
64,3% |
5 |
35,7%
|
14 |
73,7% |
|
2. |
Candidates for the position of judge |
138 |
52,5% |
125 |
47,5% |
263 |
100% |
|
2.1. |
Court staff |
72 |
55,8% |
57 |
44,2% |
129 |
49,0% |
|
2.2. |
Prosecution staff |
20 |
43,5% |
26 |
56,5% |
46 |
17,5% |
|
2.3. |
Attorneys |
15 |
53,6% |
13 |
46,4% |
28 |
10,6% |
|
2.4. |
Military personnel |
0 |
0,0% |
7 |
100,0%
|
7 |
2,7% |
|
2.5. |
Other specialists |
31 |
58,5% |
22 |
41,5% |
53 |
20,2% |
|
TOTAL |
149 |
52,8% |
133 |
47,2% |
282 |
100% |
|
Among the participants who successfully passed the qualification exam (specialisation of a local administrative court), women predominate:
women – 149, or 53% of the total number of participants;
men – 133, or 47% of the total number of participants.
The highest proportion of women was recorded among representatives of other specialists (59%), judges (58%), court staff (56%), and attorneys (54%). The highest proportion of men was observed among prosecution staff (57%) and military personnel (100%).
Overall, the results indicate an adequate level of gender representation in the selection procedure.
Age distribution of participants who successfully passed the qualification exam (specialisation of a local administrative court)
|
*age at the time of submission of documents for participation in the selection procedure |
|||||||||
|
No. z/p |
Place of work |
From 30 to 35 years |
From 36 to 40 years |
41 years and over |
TOTAL |
||||
|
persons* |
%* |
persons* |
%* |
persons* |
%* |
persons* |
%* |
||
|
1. |
Judges of local courts |
0 |
0% |
6 |
31,6% |
13 |
68,4% |
19 |
100% |
|
1.1. |
Judges of administrative courts |
0 |
0% |
1 |
20,0% |
4 |
80,0%
|
5 |
26,3% |
|
1.2. |
Judges of general courts |
0 |
0% |
5 |
35,7%
|
9 |
64,3% |
14 |
73,7% |
|
2. |
Candidates for the position of judge |
152 |
57,8% |
74 |
28,1% |
37 |
14,1% |
263 |
100% |
|
2.1. |
Court staff |
81 |
62,8% |
38 |
29,5% |
10 |
7,8% |
129 |
49,0% |
|
2.2. |
Prosecution staff |
22 |
47,8% |
15 |
32,6% |
9 |
19,6% |
46 |
17,5% |
|
2.3. |
Attorneys |
17 |
60,7% |
6 |
21,4% |
5 |
17,9% |
28 |
10,6% |
|
2.4. |
Military personnel |
5 |
71,4% |
1 |
14,3%
|
1 |
14,3% |
7 |
2,7% |
|
2.5. |
Other specialists |
27 |
50,9% |
14 |
26,4% |
12 |
22,6% |
53 |
20,2% |
|
TOTAL |
152 |
53,9% |
80 |
28,4% |
50 |
17,7% |
282 |
100% |
|
Judges of local courts who have expressed an intention to be transferred to another local court are predominantly over 41 years of age (68%); there are no persons under the age of 36 among them.
Among candidates for the position of judge, 86% are under 41 years of age.
Court staff, military personnel, and attorneys constitute the youngest categories: within the 30–35 age group, they account for 63%, 71%, and 61% respectively.
By decision of the High Qualification Commission of Judges of Ukraine of
April 01, 2026, following the fourth stage of the qualification exam – completion of the practical assignment in the specialisation of a local administrative court – 263 candidates for the position of judge of a local administrative court who achieved the passing score in the qualification exam were admitted to a special check.
Regional distribution of participants who successfully passed the qualification exam (specialisation of a local administrative court)
|
No. z/p |
Region |
Judges |
Candidates for the position of judge (persons) |
TOTAL |
|||||||||||||
|
(persons) |
Courts |
Prosecution |
Attorneys |
Military |
Other specialists |
Total |
|||||||||||
|
persons |
% |
persons |
% |
persons |
% |
persons |
% |
persons |
% |
persons |
% |
persons |
% |
persons |
% |
||
|
1 |
Vinnytsia Oblast |
0 |
0% |
8 |
62% |
2 |
15% |
1 |
8 % |
1 |
8 % |
1 |
8% |
13 |
100% |
13 |
5% |
|
2 |
Volyn Oblast |
0 |
0% |
3 |
50% |
1 |
17% |
1 |
17% |
0 |
0 % |
1 |
17% |
6 |
100% |
6 |
2% |
|
3 |
Dnipropetrovsk Oblast |
2 |
9% |
5 |
25% |
7 |
35% |
3 |
15% |
0 |
0 % |
5 |
25% |
20 |
91% |
22 |
8% |
|
4 |
Donetsk Oblast |
1 |
33% |
2 |
100% |
0 |
0% |
0 |
0 % |
0 |
0 % |
0 |
0% |
2 |
67% |
3 |
1% |
|
5 |
Zhytomyr Oblast |
4 |
31% |
3 |
33% |
3 |
33% |
1 |
11% |
0 |
0 % |
2 |
22% |
9 |
69% |
13 |
5% |
|
6 |
Transcarpathian Oblast |
0 |
0% |
6 |
75% |
1 |
13% |
1 |
13% |
0 |
0 % |
0 |
0% |
8 |
100% |
8 |
3% |
|
7 |
Zaporizhzhia Oblast |
2 |
25% |
2 |
33% |
2 |
33% |
0 |
0 % |
0 |
0 % |
2 |
33% |
6 |
75% |
8 |
3% |
|
8 |
Ivano-Frankivsk Oblast |
0 |
0% |
2 |
40% |
2 |
40% |
1 |
20% |
0 |
0 % |
0 |
0% |
5 |
100% |
5 |
2% |
|
9 |
Kyiv Oblast |
2 |
17% |
3 |
30% |
1 |
10% |
0 |
0 % |
1 |
10% |
5 |
50% |
10 |
83% |
12 |
4 % |
|
10 |
Kirovohrad Oblast |
1 |
20% |
4 |
100% |
0 |
0% |
0 |
0 % |
0 |
0 % |
0 |
0% |
4 |
80% |
5 |
2 % |
|
11 |
Luhansk Oblast |
0 |
0% |
0 |
0% |
0 |
0% |
0 |
0 % |
0 |
0 % |
0 |
0% |
0 |
0% |
0 |
0% |
|
12 |
Lviv Oblast |
1 |
3% |
24 |
69% |
2 |
6% |
4 |
11% |
0 |
0% |
5 |
14% |
35 |
97% |
36 |
13% |
|
13 |
Mykolaiv Oblast |
1 |
33% |
2 |
100% |
0 |
0% |
0 |
0 % |
0 |
0% |
0 |
0% |
2 |
67% |
3 |
1% |
|
14 |
Odesa Oblast |
1 |
4% |
7 |
32% |
5 |
23% |
4 |
18% |
1 |
5% |
5 |
23% |
22 |
96% |
23 |
8% |
|
15 |
Poltava Oblast |
0 |
0% |
2 |
33% |
2 |
33% |
0 |
0% |
0 |
0% |
2 |
33% |
6 |
100% |
6 |
2% |
|
16 |
Rivne Oblast |
0 |
0% |
1 |
25% |
0 |
0% |
1 |
25% |
0 |
0 % |
2 |
50% |
4 |
100% |
4 |
1 % |
|
17 |
Sumy Oblast |
1 |
20% |
0 |
0% |
3 |
75% |
0 |
0% |
0 |
0 % |
1 |
25% |
4 |
80%
|
5 |
2 % |
|
18 |
Ternopil Oblast |
0 |
0% |
1 |
33% |
0 |
0% |
0 |
0% |
0 |
0 % |
2 |
67% |
3 |
100% |
3 |
1 % |
|
19 |
Kharkiv Oblast |
0 |
0% |
10 |
67% |
1 |
7% |
2 |
13% |
0 |
0 % |
2 |
13% |
15 |
100% |
15 |
5 % |
|
20 |
Kherson Oblast |
0 |
0% |
0 |
0% |
0 |
0% |
0 |
0% |
0 |
0 % |
0 |
0% |
0 |
0% |
0 |
0 % |
|
21 |
Khmelnytskyi Oblast |
0 |
0% |
10 |
77% |
1 |
8% |
0 |
0% |
1 |
8 % |
1 |
8% |
13 |
100% |
13 |
5 % |
|
22 |
Cherkasy Oblast |
1 |
25% |
1 |
33% |
1 |
33% |
1 |
33% |
0 |
0 % |
0 |
0% |
3 |
75% |
4 |
1 % |
|
23 |
Chernivtsi Oblast |
0 |
0% |
1 |
33% |
1 |
33% |
0 |
0% |
1 |
33% |
0 |
0% |
3 |
100% |
3 |
1 % |
|
24 |
Chernihiv Oblast |
2 |
29% |
1 |
20% |
2 |
40% |
0 |
0% |
0 |
0 % |
2 |
40% |
5 |
71% |
7 |
2 % |
|
25 |
Kyiv City |
0 |
0% |
31 |
48% |
9 |
14% |
8 |
12% |
2 |
3 % |
15 |
23% |
65 |
100% |
65 |
23 % |
|
TOTAL |
19 |
7% |
129 |
49% |
46 |
17% |
28 |
11% |
7 |
3 % |
53 |
20% |
263 |
93% |
282 |
100% |
|
The Kyiv City confidently leads in terms of the number of persons seeking to become judges, accounting for 23% of all participants.
The highest level of participation among candidates for the position of judge was recorded in the Kyiv City, as well as in Lviv, Odesa, Dnipropetrovsk, and Kharkiv Oblasts, which together account for 57% of the total number of candidates.